By Illumination Consulting Editorial Team · Updated 2026-07-29
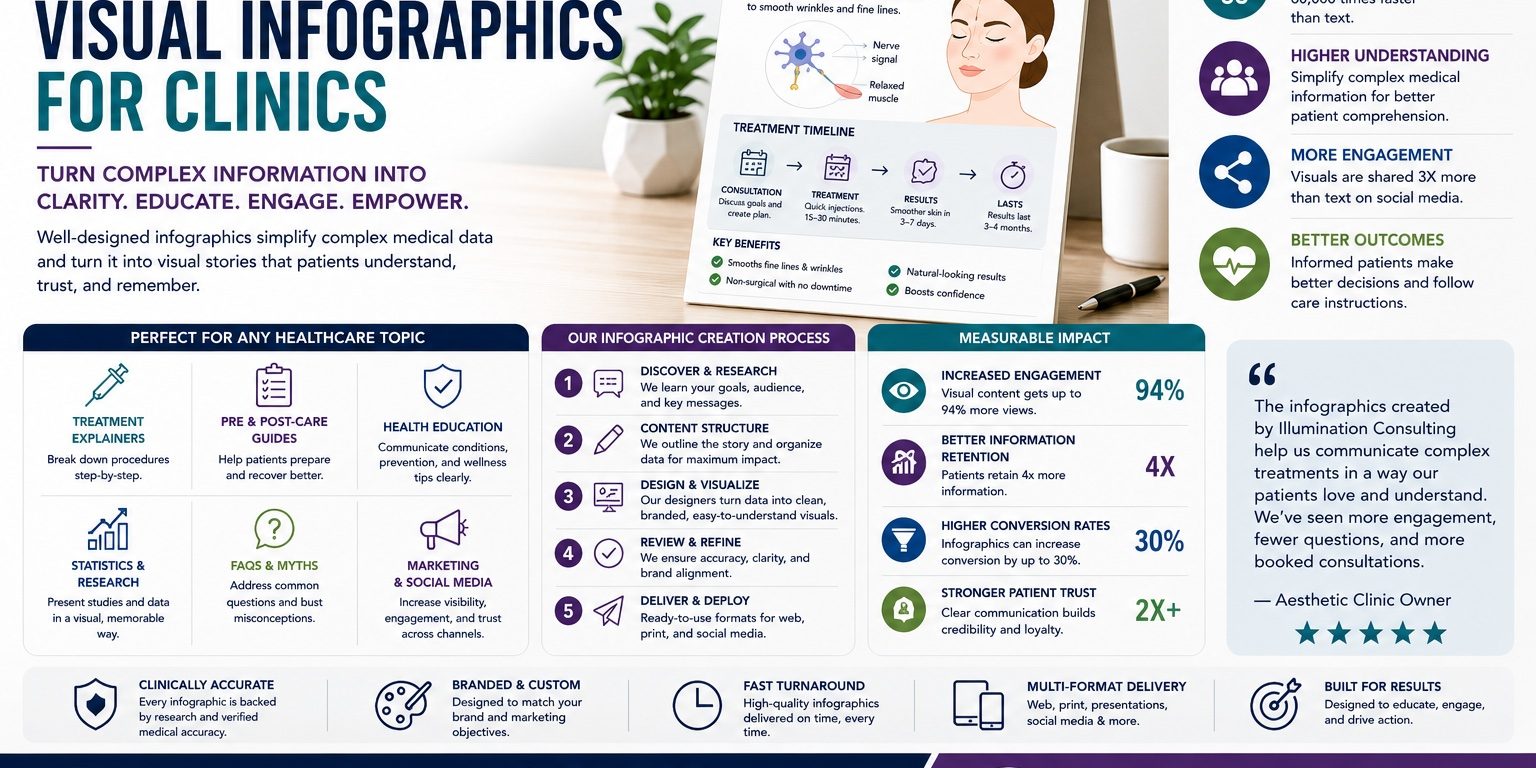
Healthcare infographics turn dense medical data into patient-friendly visuals, since brains process images 60,000 times faster than text. Effective design pairs clear data visualization with plain-language explanations, improving patient education and health outcomes, a topic explored further in SEO marketing services. Marketing managers without in-house design teams benefit from structured infographic development that maintains clinical accuracy while boosting engagement, shareability, and comprehension across websites, patient portals, and social channels.
Key Takeaways
- Brains process visual content 60,000 times faster than plain text, making infographics ideal for healthcare communication.
- Infographics simplify complex medical terminology and health data that overwhelms average patients seeking health information.
- Self-contained visual infographics convey complete stories and concepts at a glance across newspapers, blogs, and social media.
- Healthcare organizations use infographics to bridge communication gaps and improve patient education and health outcomes directly.
Why Do Patients Respond Better to Visuals?
Visual information sticks; written explanations often don’t. Retention research shows the brain remembers 80 percent of what it sees, compared with only 20 percent of what it reads. That gap explains why clinics investing in infographics for clinics see stronger patient comprehension than those relying on text-heavy handouts or dense consent forms.
Medical terminology creates the problem in the first place. Concepts that feel routine to a provider — dosage schedules, recovery timelines, procedure risks — often overwhelm the average patient. Left unaddressed, that communication gap damages patient education and, ultimately, health outcomes.
What role does visual content play before a patient books an appointment?
Patients research treatments extensively before scheduling a consultation. Visual content marketing meets them at that research stage, translating clinical detail into something scannable and shareable across websites and social channels.
Why does design quality matter for patient trust?
Sloppy graphics undermine credibility fast. Strong medical infographics design signals professionalism while making complex protocols digestible in seconds rather than paragraphs.
Clinics that pair clear visuals with accurate messaging typically see three outcomes:
- Higher retention of pre-procedure instructions
- Fewer follow-up calls asking to clarify basic information
- Stronger engagement on marketing and patient-education channels alike
Visuals aren’t decoration. They’re a comprehension tool built for how the brain actually processes information.
What Makes Medical Infographics Effective and Compliant?
Effectiveness starts with a clear definition. An infographic functions as a visualization of data or ideas, built specifically for quick comprehension rather than deep reading. For clinics and health systems, that speed matters: patients scanning a discharge sheet or social post need the message in seconds, not minutes.
Medical infographics design succeeds when structure supports clarity. Consistent icons, colors, and fonts across every asset reinforce professionalism and prevent visual confusion. A hospital that varies its color palette from post to post signals inconsistency, and patients notice.
Why does color and font choice matter in healthcare visuals?
Color and typography, as detailed in Plastic Surgery Marketing: Aesthetic Clinics & Med Spas, carry emotional weight, not just aesthetic value. Thoughtful choices emphasize key messages, guide the eye toward critical warnings or instructions, and evoke the calm, trustworthy tone patients expect from a provider.
Strong infographics for clinics typically share these traits:
- Uniform icon style across all campaigns
- A restrained, brand-aligned color palette
- Fonts chosen for readability at small sizes
- Clear visual hierarchy separating warnings from general information
How does the website support visual content marketing?
A well-built content platform stores, organizes, and serves these assets without slowing the site down. Proper visual content marketing infrastructure improves usability, search visibility, and page performance, giving every infographic a stable foundation for reach and longevity.
How Should Clinics Build a Visual Content Strategy?
A strong visual content strategy starts with placing infographics for clinics inside a larger growth system. Outlined in Aesthetic Clinics & Med Spas, not treating them as a one-off design project. Clinics that pair visuals with strategic SEO attract qualified patients and build organic growth without depending entirely on paid ads. Growth-focused consulting ties visual assets to broader goals like patient acquisition, conversion optimization, and reputation management.
What belongs in a clinic’s visual content plan?
Effective visual content marketing works best as part of a coordinated system rather than isolated graphics. Consulting support typically spans several connected areas:
- Website design that showcases visual assets clearly
- SEO strategy that helps infographics surface in search results
- Patient acquisition campaigns built around shareable visuals
- Conversion optimization to turn views into booked appointments
- Reputation management that reinforces trust signals across content
Who should manage medical infographics after launch?
Ongoing publishing shouldn’t require a developer for every update. A modern content platform lets marketing staff and communications leads publish, update, and manage media independently. This matters most for medical infographics design, since clinics regularly refresh statistics, service details, and patient education material. Coordinated content, SEO, and platform strategy keeps visual assets current and measurable over time.
Visual Storytelling for Complex Medical Treatments: Layer-by-Layer Dermal Science
Communicating complex medical treatments, particularly in dermatology, demands an approach that integrates clarity, accuracy, and visual appeal. To enhance patient health literacy, it’s crucial to distill intricate biological processes such as subcutaneous fat layers, collagen synthesis via radiofrequency (RF) microneedling, and neuromuscular junction blocking by neuromodulators into digestible visual narratives.
Begin by employing anatomical illustrations that layer information progressively. For example, a multi-layered infographic can visually separate the epidermis, dermis, and subcutaneous fat, with callouts explaining each layer’s function. Using color coding aligned within the clinic’s brand visual hierarchy helps maintain consistency and supports cognitive mapping.
When illustrating RF microneedling, diagrams should depict the device’s microneedles penetrating the skin layers, triggering collagen synthesis. Animating or sequencing these effects in a carousel or step graphic enhances patient understanding of treatment mechanisms.
For explaining neuromodulator effects on the neuromuscular junction, visual micro-content such as simplified depictions of nerve signaling blocks paired with text clarifies the process. Incorporate infographics with clear visual hierarchies that distinguish warnings, benefits, and timelines to guide patients through treatment expectations and outcomes.
By breaking down these complex biomedical concepts into layer-by-layer visual stories, clinics elevate patient empowerment, enabling informed consent and adherence to post-treatment care.
Repurposing Infographics into Multi-Slide Social Carousels, PDFs, and Treatment Guides
Maximizing the impact of comprehensive infographics requires smart asset repurposing tailored to various platforms and patient touchpoints.
The workflow begins by deconstructing a full-length infographic into modular visual micro-content segments. Each segment conveys a singular, focused idea or step within the overall message. For social platforms like Instagram and LinkedIn, these become multi-slide carousel posts designed with a social-first asset design approach. Slides should utilize concise copy, bold visuals, and consistent branding, maintaining legibility and engagement.
Next, convert the full infographic content into downloadable PDFs tailored as post-care guides or educational brochures. These documents should employ accessible typography and interactive elements such as clickable table of contents or embedded videos if possible. Treatment guides for consultation rooms can mirror these PDFs but emphasize physical print-friendly formats with standardized page sizes and durable materials.
This step-by-step repurposing not only extends the content’s lifespan but also enhances patient education across channels, improving trust and treatment adherence.
Designing Before-and-After Treatment Timelines & Downtime Expectations
Patient expectations management is vital in aesthetic and medical dermatology clinics. Well-designed timelines and illustrative guides effectively set realistic outcomes and reduce uncertainty around treatment recovery.
Design principles include the use of precise anatomical illustrations that correlate with specific treatment areas. Before-and-after images must be captured under standardized lighting and angle guidelines to ensure authenticity and comparability. Clinics should educate staff on these standards to collect consistent photographic assets.
Healing timeline charts, displayed as infographics within patient consultation binders, visually map recovery phases—immediate post-procedure, peak downtime, gradual improvement, and final results. Incorporating icons, color-coded stages, and clear labels fosters intuitive understanding.
Clinical recovery infographics should balance technical accuracy with readability, utilizing a brand visual hierarchy that prioritizes essential information such as warning signs, supportive care tips, and typical duration. Combining visual cues with succinct narratives ensures patients can plan accordingly and reduces anxiety.
Infographic SEO: Image Optimization, Structured Data, and Visual Link Building
Effective healthcare infographics gain amplified reach through robust SEO practices tailored to visual content.
High-resolution images optimized using modern formats like WebP significantly improve page load times without sacrificing quality. Each image must carry descriptive and keyword-rich ALT text crafted with an ALT text architecture approach, balancing human readability and search engine indexing.
Implementing ImageObject schema markup provides structured data that helps search engines categorize and display images attractively in visual search results. This metadata enhances indexing for platforms like Google Images and Pinterest, the latter benefiting from Pinterest visual search optimization strategies linking back to clinic content.
Moreover, clinics should actively pursue editorial backlink generation by contributing guest posts, sharing case studies, and collaborating with healthcare publications. High-authority backlinks boost domain authority and infographic visibility, indirectly improving patient acquisition pathways.
Integrating these SEO techniques ensures that infographics do not just educate patients but also serve as effective marketing assets supporting organic growth and informed patient engagement.
FAQ
Why do patients respond better to visual content than text?
The brain processes visuals 60,000 times faster than text. Retains 80 percent of what it sees, compared with only 20 percent of what it reads, making infographics far more effective for patient comprehension.
Why does design consistency matter in medical infographics?
Consistent icons, colors, and fonts across every asset reinforce professionalism and prevent visual confusion. Clinics that vary their palette from post to post signal inconsistency, and patients notice.
Who can help clinics develop effective healthcare infographics?
Illumination Consulting, based in Beverly Hills, CA, helps clinics transform medical data into patient-friendly infographics that boost engagement and retention while maintaining clinical accuracy.
Facts
- Illumination Consulting is located in Beverly Hills, CA, USA.